
There’s a lot of data inside Dentrix Enterprise. All that data can be overwhelming if you do not have the proper tools to decipher that data and display it in easy-to-understand ways. You need tools and reports that can help you turn that data into actionable insights and help you better understand your patients and their dental health habits.
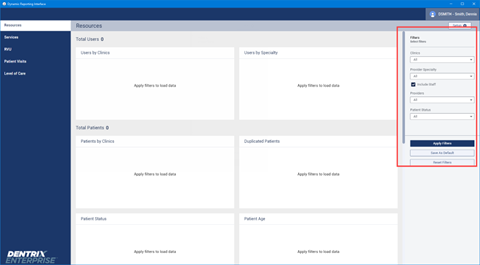
The Dynamic Reporting Dashboard released in Dentrix Enterprise 11.0.43 is a new tool in Dentrix Enterprise that provides real-time, data-driven visuals that makes it easier for your organization to spot actionable insights, such as resource constraints, or to compare patient data between your clinics.
The Dynamic Reporting Dashboard presents data in four main categories: Resources, Services, RVU, and Patient Visits. Also, the dashboard presents the data using interactive visual elements (widgets).
With these widgets you can drill down into the data, providing greater insight into your organization. You can choose how the data is displayed, such as in a table, pie chart, or column chart.
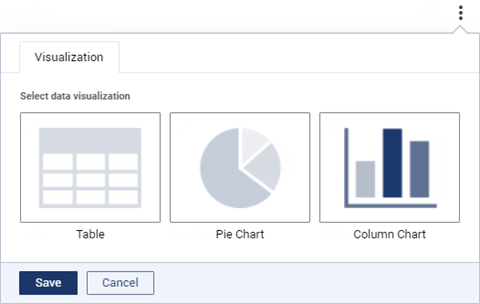
You can also hide or show the widgets that make the most sense for you. You can filter the data by a specific date range or by clinics, providers, or patient statuses.
Here are some examples of the powerful data widgets available to you on the Dynamic Reporting Dashboard:
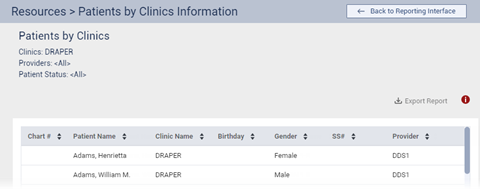
patients by clinics
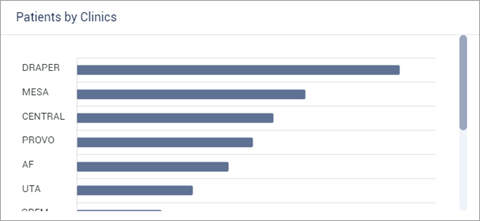
Accessed from the Resources category, this widget will display the number of patients in each clinic of your organization. Clicking the name of the clinic will allow you drill-down into the data and view details of each patient in the clinic.
services by clinics
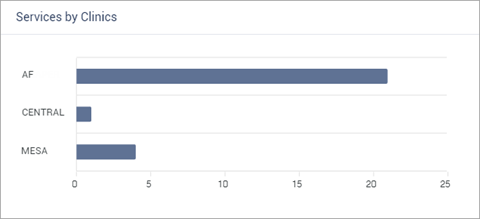
Accessed from the Services category, this widget displays the production amount from completed procedures in each clinic. This only shows the production amount completed within the specified date range for the specified range of procedure codes.
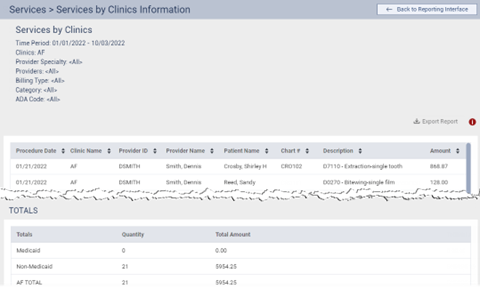
Clicking on the name of the clinic will open the Services by Clinic Information page, where you can view the details of each procedure. If you see Medicaid patients in your organization, this widget will also break down the production totals for all your Medicaid and non-Medicaid patients.
RVU by Primary providers
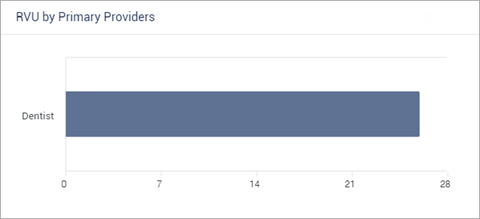
Accessed through the RVU category, this widget will display the relative value units (RVU) from completed procedures for each primary provider in your organization. This only shows RVU from completed procedures within the specified date range for the specified range of procedure codes.
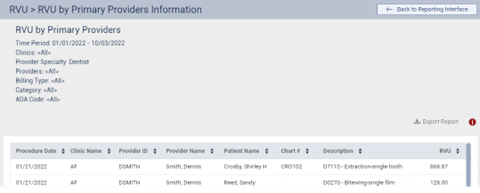
Click the primary provider specialty to open the RVU by Primary Providers Information page and view details of each procedure.
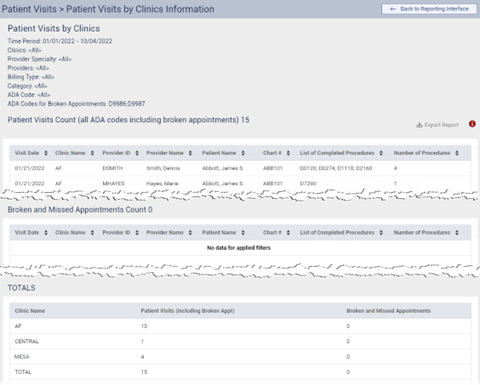
patient visits by clinics

Accessed through the Patient Visits category, you can view the number of visits by patients during the specified time frame in addition to the number of broken and missed appointments for each clinic.
Clicking the name of the clinic will open the Patient Visits by Clinics Information page so you can drill down and view each patient visit and the treatment provided.
Having this information readily available from the Dynamic Reporting Dashboard will allow you to gain valuable insights into your patients and your organization.
To learn more about Dynamic Reporting, watch this video. and view this online Help file.


